
Indications and Usage
GLUCOVANCE (Glyburide and Metformin HCl) Tablets is indicated as an adjunct to diet and exercise to improve glycemic control in adults with type 2 diabetes mellitus.
Dosage and Administration
General Considerations
Dosage of GLUCOVANCE must be individualized on the basis of both effectiveness and tolerance while not exceeding the maximum recommended daily dose of 20 mg glyburide/2000 mg metformin. GLUCOVANCE should be given with meals and should be initiated at a low dose, with gradual dose escalation as described below, in order to avoid hypoglycemia (largely due to glyburide), reduce GI side effects (largely due to metformin), and permit determination of the minimum effective dose for adequate control of blood glucose for the individual patient.
With initial treatment and during dose titration, appropriate blood glucose monitoring should be used to determine the therapeutic response to GLUCOVANCE and to identify the minimum effective dose for the patient. Thereafter, HbA1c should be measured at intervals of approximately 3 months to assess the effectiveness of therapy. The therapeutic goal in all patients with type 2 diabetes is to decrease FPG, PPG, and HbA1c to normal or as near normal as possible. Ideally, the response to therapy should be evaluated using HbA1c (glycosylated hemoglobin), which is a better indicator of long-term glycemic control than FPG alone.
No studies have been performed specifically examining the safety and efficacy of switching to GLUCOVANCE therapy in patients taking concomitant glyburide (or other sulfonylurea) plus metformin. Changes in glycemic control may occur in such patients, with either hyperglycemia or hypoglycemia possible. Any change in therapy of type 2 diabetes should be undertaken with care and appropriate monitoring.
GLUCOVANCE in Patients with Inadequate Glycemic Control on Diet and Exercise
Recommended starting dose: 1.25 mg/250 mg once or twice daily with meals.
For patients with type 2 diabetes whose hyperglycemia cannot be satisfactorily managed with diet and exercise alone, the recommended starting dose of GLUCOVANCE is 1.25 mg/250 mg once a day with a meal. As initial therapy in patients with baseline HbA1c >9% or an FPG >200 mg/dL, a starting dose of GLUCOVANCE 1.25 mg/250 mg twice daily with the morning and evening meals may be used. Dosage increases should be made in increments of 1.25 mg/250 mg per day every 2 weeks up to the minimum effective dose necessary to achieve adequate control of blood glucose. In clinical trials of GLUCOVANCE as initial therapy, there was no experience with total daily doses >10 mg/2000 mg per day. GLUCOVANCE 5 mg/500 mg should not be used as initial therapy due to an increased risk of hypoglycemia.
GLUCOVANCE Use in Patients with Inadequate Glycemic Control on a Sulfonylurea and/or Metformin
Recommended starting dose: 2.5 mg/500 mg or 5 mg/500 mg twice daily with meals.
For patients not adequately controlled on either glyburide (or another sulfonylurea) or metformin alone, the recommended starting dose of GLUCOVANCE is 2.5 mg/500 mg or 5 mg/500 mg twice daily with the morning and evening meals. In order to avoid hypoglycemia, the starting dose of GLUCOVANCE should not exceed the daily doses of glyburide or metformin already being taken. The daily dose should be titrated in increments of no more than 5 mg/500 mg up to the minimum effective dose to achieve adequate control of blood glucose or to a maximum dose of 20 mg/2000 mg per day.
For patients previously treated with combination therapy of glyburide (or another sulfonylurea) plus metformin, if switched to GLUCOVANCE, the starting dose should not exceed the daily dose of glyburide (or equivalent dose of another sulfonylurea) and metformin already being taken. Patients should be monitored closely for signs and symptoms of hypoglycemia following such a switch and the dose of GLUCOVANCE should be titrated as described above to achieve adequate control of blood glucose.
Addition of Thiazolidinediones to GLUCOVANCE Therapy
For patients not adequately controlled on GLUCOVANCE, a thiazolidinedione can be added to GLUCOVANCE therapy. When a thiazolidinedione is added to GLUCOVANCE therapy, the current dose of GLUCOVANCE can be continued and the thiazolidinedione initiated at its recommended starting dose. For patients needing additional glycemic control, the dose of the thiazolidinedione can be increased based on its recommended titration schedule. The increased glycemic control attainable with GLUCOVANCE plus a thiazolidinedione may increase the potential for hypoglycemia at any time of day. In patients who develop hypoglycemia when receiving GLUCOVANCE and a thiazolidinedione, consideration should be given to reducing the dose of the glyburide component of GLUCOVANCE. As clinically warranted, adjustment of the dosages of the other components of the antidiabetic regimen should also be considered.
Specific Patient Populations
GLUCOVANCE is not recommended for use during pregnancy. The initial and maintenance dosing of GLUCOVANCE should be conservative in patients with advanced age, due to the potential for decreased renal function in this population. Any dosage adjustment requires a careful assessment of renal function. Generally, elderly, debilitated, and malnourished patients should not be titrated to the maximum dose of GLUCOVANCE to avoid the risk of hypoglycemia. Monitoring of renal function is necessary to aid in prevention of metformin-associated lactic acidosis, particularly in the elderly. (See WARNINGS .)
Contraindications
GLUCOVANCE is contraindicated in patients with:
- Renal disease or renal dysfunction (eg, as suggested by serum creatinine levels ≥1.5 mg/dL [males], ≥1.4 mg/dL [females], or abnormal creatinine clearance) which may also result from conditions such as cardiovascular collapse (shock), acute myocardial infarction, and septicemia (see WARNINGS and PRECAUTIONS ).
- Known hypersensitivity to metformin hydrochloride or glyburide.
- Acute or chronic metabolic acidosis, including diabetic ketoacidosis, with or without coma. Diabetic ketoacidosis should be treated with insulin.
GLUCOVANCE should be temporarily discontinued in patients undergoing radiologic studies involving intravascular administration of iodinated contrast materials, because use of such products may result in acute alteration of renal function. (See also PRECAUTIONS .)
Adverse Reactions
GLUCOVANCE
In double-blind clinical trials involving GLUCOVANCE as initial therapy or as second-line therapy, a total of 642 patients received GLUCOVANCE, 312 received metformin therapy, 324 received glyburide therapy, and 161 received placebo. The percent of patients reporting events and types of adverse events reported in clinical trials of GLUCOVANCE (all strengths) as initial therapy and second-line therapy are listed in Table 6.
|
Adverse Event |
Number (%) of Patients | |||
|
Placebo N=161 |
Glyburide N=324 |
Metformin N=312 |
GLUCOVANCE N=642 |
|
| Upper respiratory infection | 22 (13.7) | 57 (17.6) | 51 (16.3) | 111 (17.3) |
| Diarrhea | 9 (5.6) | 20 (6.2) | 64 (20.5) | 109 (17.0) |
| Headache | 17 (10.6) | 37 (11.4) | 29 (9.3) | 57 (8.9) |
| Nausea/vomiting | 10 (6.2) | 17 (5.2) | 38 (12.2) | 49 (7.6) |
| Abdominal pain | 6 (3.7) | 10 (3.1) | 25 (8.0) | 44 (6.9) |
| Dizziness | 7 (4.3) | 18 (5.6) | 12 (3.8) | 35 (5.5) |
In a controlled clinical trial of rosiglitazone versus placebo in patients treated with GLUCOVANCE (n=365), 181 patients received GLUCOVANCE with rosiglitazone and 184 received GLUCOVANCE with placebo.
Edema was reported in 7.7% (14/181) of patients treated with rosiglitazone compared to 2.2% (4/184) of patients treated with placebo. A mean weight gain of 3 kg was observed in rosiglitazone-treated patients.
Disulfiram-like reactions have very rarely been reported in patients treated with glyburide tablets.
Hypoglycemia
In controlled clinical trials of GLUCOVANCE there were no hypoglycemic episodes requiring medical intervention and/or pharmacologic therapy; all events were managed by the patients. The incidence of reported symptoms of hypoglycemia (such as dizziness, shakiness, sweating, and hunger), in the initial therapy trial of GLUCOVANCE are summarized in Table 7. The frequency of hypoglycemic symptoms in patients treated with GLUCOVANCE 1.25 mg/250 mg was highest in patients with a baseline HbA1c <7%, lower in those with a baseline HbA1c of between 7% and 8%, and was comparable to placebo and metformin in those with a baseline HbA1c >8%. For patients with a baseline HbA1c between 8% and 11% treated with GLUCOVANCE 2.5 mg/500 mg as initial therapy, the frequency of hypoglycemic symptoms was 30% to 35%. As second-line therapy in patients inadequately controlled on sulfonylurea alone, approximately 6.8% of all patients treated with GLUCOVANCE experienced hypoglycemic symptoms. When rosiglitazone was added to GLUCOVANCE therapy, 22% of patients reported 1 or more fingerstick glucose measurements ≤50 mg/dL compared to 3.3% of placebo-treated patients. All hypoglycemic events were managed by the patients and only 1 patient discontinued for hypoglycemia. (See PRECAUTIONS: General: Addition of Thiazolidinediones to GLUCOVANCE Therapy .)
Gastrointestinal Reactions
The incidence of gastrointestinal (GI) side effects (diarrhea, nausea/vomiting, and abdominal pain) in the initial therapy trial are summarized in Table 7. Across all GLUCOVANCE trials, GI symptoms were the most common adverse events with GLUCOVANCE and were more frequent at higher dose levels. In controlled trials, <2% of patients discontinued GLUCOVANCE therapy due to GI adverse events.
| Variable |
Placebo N=161 |
Glyburide Tablets N=160 |
Metformin Tablets N=159 |
GLUCOVANCE 1.25 mg/250 mg Tablets N=158 |
GLUCOVANCE 2.5 mg/500 mg Tablets N=162 |
| Mean Final Dose | 0 mg | 5.3 mg | 1317 mg | 2.78 mg/557 mg | 4.1 mg/824 mg |
| Number
(%) of patients with symptoms of hypoglycemia |
5 (3.1) | 34 (21.3) | 5 (3.1) | 18 (11.4) | 61 (37.7) |
| Number
(%) of patients with gastrointestinal adverse events |
39 (24.2) | 38 (23.8) | 69 (43.3) | 50 (31.6) | 62 (38.3) |
In postmarketing reports cholestatic jaundice and hepatitis may occur rarely which may progress to liver failure; GLUCOVANCE should be discontinued if this occurs.
Drug Interactions
GLUCOVANCE
Certain drugs tend to produce hyperglycemia and may lead to loss of blood glucose control. These drugs include thiazides and other diuretics, corticosteroids, phenothiazines, thyroid products, estrogens, oral contraceptives, phenytoin, nicotinic acid, sympathomimetics, calcium channel blocking drugs, and isoniazid. When such drugs are administered to a patient receiving GLUCOVANCE, the patient should be closely observed for loss of blood glucose control. When such drugs are withdrawn from a patient receiving GLUCOVANCE, the patient should be observed closely for hypoglycemia. Metformin is negligibly bound to plasma proteins and is, therefore, less likely to interact with highly protein-bound drugs such as salicylates, sulfonamides, chloramphenicol, and probenecid as compared to sulfonylureas, which are extensively bound to serum proteins.
Glyburide
The hypoglycemic action of sulfonylureas may be potentiated by certain drugs, including nonsteroidal anti-inflammatory agents and other drugs that are highly protein bound, salicylates, sulfonamides, chloramphenicol, probenecid, coumarins, monoamine oxidase inhibitors, and beta-adrenergic blocking agents. When such drugs are administered to a patient receiving GLUCOVANCE, the patient should be observed closely for hypoglycemia. When such drugs are withdrawn from a patient receiving GLUCOVANCE, the patient should be observed closely for loss of blood glucose control.
A possible interaction between glyburide and ciprofloxacin, a fluoroquinolone antibiotic, has been reported, resulting in a potentiation of the hypoglycemic action of glyburide. The mechanism for this interaction is not known.
A potential interaction between oral miconazole and oral hypoglycemic agents leading to severe hypoglycemia has been reported. Whether this interaction also occurs with the intravenous, topical, or vaginal preparations of miconazole is not known.
Metformin Hydrochloride
Furosemide
A single-dose, metformin-furosemide drug interaction study in healthy subjects demonstrated that pharmacokinetic parameters of both compounds were affected by coadministration. Furosemide increased the metformin plasma and blood Cmax by 22% and blood AUC by 15%, without any significant change in metformin renal clearance. When administered with metformin, the Cmax and AUC of furosemide were 31% and 12% smaller, respectively, than when administered alone, and the terminal half-life was decreased by 32%, without any significant change in furosemide renal clearance. No information is available about the interaction of metformin and furosemide when coadministered chronically.
Nifedipine
A single-dose, metformin-nifedipine drug interaction study in normal healthy volunteers demonstrated that coadministration of nifedipine increased plasma metformin Cmax and AUC by 20% and 9%, respectively, and increased the amount excreted in the urine. Tmax and half-life were unaffected. Nifedipine appears to enhance the absorption of metformin. Metformin had minimal effects on nifedipine.
Cationic drugs
Cationic drugs (eg, amiloride, digoxin, morphine, procainamide, quinidine, quinine, ranitidine, triamterene, trimethoprim, or vancomycin) that are eliminated by renal tubular secretion theoretically have the potential for interaction with metformin by competing for common renal tubular transport systems. Such interaction between metformin and oral cimetidine has been observed in normal healthy volunteers in both single- and multiple-dose, metformin-cimetidine drug interaction studies, with a 60% increase in peak metformin plasma and whole blood concentrations and a 40% increase in plasma and whole blood metformin AUC. There was no change in elimination half-life in the single-dose study. Metformin had no effect on cimetidine pharmacokinetics. Although such interactions remain theoretical (except for cimetidine), careful patient monitoring and dose adjustment of GLUCOVANCE and/or the interfering drug is recommended in patients who are taking cationic medications that are excreted via the proximal renal tubular secretory system.
Other
In healthy volunteers, the pharmacokinetics of metformin and propranolol and metformin and ibuprofen were not affected when coadministered in single-dose interaction studies.
Use in Specific Populations
Patients With Type 2 Diabetes
Multiple-dose studies with glyburide in patients with type 2 diabetes demonstrate drug level concentration-time curves similar to single-dose studies, indicating no buildup of drug in tissue depots.
In the presence of normal renal function, there are no differences between single- or multiple-dose pharmacokinetics of metformin between patients with type 2 diabetes and normal subjects (see Table 1 ), nor is there any accumulation of metformin in either group at usual clinical doses.
Hepatic Insufficiency
No pharmacokinetic studies have been conducted in patients with hepatic insufficiency for either glyburide or metformin.
Renal Insufficiency
No information is available on the pharmacokinetics of glyburide in patients with renal insufficiency.
In patients with decreased renal function (based on creatinine clearance), the plasma and blood half-life of metformin is prolonged and the renal clearance is decreased in proportion to the decrease in creatinine clearance (see Table 1 ; also, see WARNINGS ).
Geriatrics
There is no information on the pharmacokinetics of glyburide in elderly patients.
Limited data from controlled pharmacokinetic studies of metformin in healthy elderly subjects suggest that total plasma clearance is decreased, the half-life is prolonged, and Cmax is increased, when compared to healthy young subjects. From these data, it appears that the change in metformin pharmacokinetics with aging is primarily accounted for by a change in renal function (see Table 1 ). Metformin treatment should not be initiated in patients ≥80 years of age unless measurement of creatinine clearance demonstrates that renal function is not reduced.
|
Subject Groups: Metformin
Dosea
(number of subjects) |
Cmax
b
(µg/mL) |
Tmax
c
(hrs) |
Renal Clearance (mL/min) |
|---|---|---|---|
| a All doses given fasting except the first 18 doses of the multiple-dose studies | |||
| b Peak plasma concentration | |||
| c Time to peak plasma concentration | |||
| d SD=single dose | |||
| e Combined results (average means) of 5 studies: mean age 32 years (range 23-59 years) | |||
| f Kinetic study done following dose 19, given fasting | |||
| g Elderly subjects, mean age 71 years (range 65-81 years) | |||
| h CLcr=creatinine clearance normalized to body surface area of 1.73 m2 | |||
| Healthy, nondiabetic adults: | |||
| 500 mg SDd (24) | 1.03 (±0.33) | 2.75 (±0.81) | 600 (±132) |
| 850 mg SD (74)e | 1.60 (±0.38) | 2.64 (±0.82) | 552 (±139) |
| 850 mg t.i.d. for 19 dosesf (9) | 2.01 (±0.42) | 1.79 (±0.94) | 642 (±173) |
| Adults with type 2 diabetes: | |||
| 850 mg SD (23) | 1.48 (±0.5) | 3.32 (±1.08) | 491 (±138) |
| 850 mg t.i.d. for 19 dosesf (9) | 1.90 (±0.62) | 2.01 (±1.22) | 550 (±160) |
| Elderlyg, healthy nondiabetic adults: | |||
| 850 mg SD (12) | 2.45 (±0.70) | 2.71 (±1.05) | 412 (±98) |
| Renal-impaired adults: 850 mg SD | |||
| Mild (CLcr h 61-90 mL/min) (5) | 1.86 (±0.52) | 3.20 (±0.45) | 384 (±122) |
| Moderate (CLcr 31-60 mL/min) (4) | 4.12 (±1.83) | 3.75 (±0.50) | 108 (±57) |
| Severe (CLcr 10-30 mL/min) (6) | 3.93 (±0.92) | 4.01 (±1.10) | 130 (±90) |
Pediatrics
After administration of a single oral GLUCOPHAGE® (metformin hydrochloride) 500 mg tablet with food, geometric mean metformin Cmax and AUC differed <5% between pediatric type 2 diabetic patients (12-16 years of age) and gender- and weight-matched healthy adults (20-45 years of age), all with normal renal function.
After administration of a single oral GLUCOVANCE tablet with food, dose-normalized geometric mean glyburide Cmax and AUC in pediatric patients with type 2 diabetes (11-16 years of age, n=28, mean body weight of 97 kg) differed <6% from historical values in healthy adults.
Gender
There is no information on the effect of gender on the pharmacokinetics of glyburide.
Metformin pharmacokinetic parameters did not differ significantly in subjects with or without type 2 diabetes when analyzed according to gender (males=19, females=16). Similarly, in controlled clinical studies in patients with type 2 diabetes, the antihyperglycemic effect of metformin was comparable in males and females.
Race
No information is available on race differences in the pharmacokinetics of glyburide.
No studies of metformin pharmacokinetic parameters according to race have been performed. In controlled clinical studies of metformin in patients with type 2 diabetes, the antihyperglycemic effect was comparable in whites (n=249), blacks (n=51), and Hispanics (n=24).
Overdosage
Glyburide
Overdosage of sulfonylureas, including glyburide tablets, can produce hypoglycemia. Mild hypoglycemic symptoms, without loss of consciousness or neurological findings, should be treated aggressively with oral glucose and adjustments in drug dosage and/or meal patterns. Close monitoring should continue until the physician is assured that the patient is out of danger. Severe hypoglycemic reactions with coma, seizure, or other neurological impairment occur infrequently, but constitute medical emergencies requiring immediate hospitalization. If hypoglycemic coma is diagnosed or suspected, the patient should be given a rapid intravenous injection of concentrated (50%) glucose solution. This should be followed by a continuous infusion of a more dilute (10%) glucose solution at a rate that will maintain the blood glucose at a level above 100 mg/dL. Patients should be closely monitored for a minimum of 24 to 48 hours, since hypoglycemia may recur after apparent clinical recovery.
Metformin Hydrochloride
Overdose of metformin hydrochloride has occurred, including ingestion of amounts >50 g. Hypoglycemia was reported in approximately 10% of cases, but no causal association with metformin hydrochloride has been established. Lactic acidosis has been reported in approximately 32% of metformin overdose cases (see WARNINGS ). Metformin is dialyzable with a clearance of up to 170 mL/min under good hemodynamic conditions. Therefore, hemodialysis may be useful for removal of accumulated drug from patients in whom metformin overdosage is suspected.
Description
GLUCOVANCE® (Glyburide and Metformin HCl) Tablets contain 2 oral antihyperglycemic drugs used in the management of type 2 diabetes, glyburide and metformin hydrochloride.
Glyburide is an oral antihyperglycemic drug of the sulfonylurea class. The chemical name for glyburide is 1-[[p-[2-(5-chloro-o-anisamido)ethyl]phenyl]sulfonyl]-3-cyclo-hexylurea. Glyburide is a white to off-white crystalline compound with a molecular formula of C23H28ClN3O5S and a molecular weight of 494.01. The glyburide used in GLUCOVANCE has a particle size distribution of 25% undersize value not more than 6 µm, 50% undersize value not more than 7 to 10 µm, and 75% undersize value not more than 21 µm. The structural formula is represented below.

Metformin hydrochloride is an oral antihyperglycemic drug used in the management of type 2 diabetes. Metformin hydrochloride (N,N-dimethylimidodicarbonimidic diamide monohydrochloride) is not chemically or pharmacologically related to sulfonylureas, thiazolidinediones, or α-glucosidase inhibitors. It is a white to off-white crystalline compound with a molecular formula of C4H12ClN5 (monohydrochloride) and a molecular weight of 165.63. Metformin hydrochloride is freely soluble in water and is practically insoluble in acetone, ether, and chloroform. The pKa of metformin is 12.4. The pH of a 1% aqueous solution of metformin hydrochloride is 6.68. The structural formula is as shown:
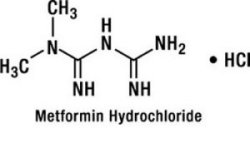
GLUCOVANCE is available for oral administration in tablets containing 1.25 mg glyburide with 250 mg metformin hydrochloride, 2.5 mg glyburide with 500 mg metformin hydrochloride, and 5 mg glyburide with 500 mg metformin hydrochloride. In addition, each tablet contains the following inactive ingredients: microcrystalline cellulose, povidone, croscarmellose sodium, and magnesium stearate. The tablets are film coated, which provides color differentiation.
Clinical Pharmacology
Mechanism of Action
GLUCOVANCE combines glyburide and metformin hydrochloride, 2 antihyperglycemic agents with complementary mechanisms of action, to improve glycemic control in patients with type 2 diabetes.
Glyburide appears to lower blood glucose acutely by stimulating the release of insulin from the pancreas, an effect dependent upon functioning beta cells in the pancreatic islets. The mechanism by which glyburide lowers blood glucose during long-term administration has not been clearly established. With chronic administration in patients with type 2 diabetes, the blood glucose-lowering effect persists despite a gradual decline in the insulin secretory response to the drug. Extrapancreatic effects may be involved in the mechanism of action of oral sulfonylurea hypoglycemic drugs.
Metformin hydrochloride is an antihyperglycemic agent that improves glucose tolerance in patients with type 2 diabetes, lowering both basal and postprandial plasma glucose. Metformin hydrochloride decreases hepatic glucose production, decreases intestinal absorption of glucose, and improves insulin sensitivity by increasing peripheral glucose uptake and utilization.
Pharmacokinetics
Absorption and Bioavailability
GLUCOVANCE
In bioavailability studies of GLUCOVANCE 2.5 mg/500 mg and 5 mg/500 mg, the mean area under the plasma concentration versus time curve (AUC) for the glyburide component was 18% and 7%, respectively, greater than that of the Micronase® brand of glyburide coadministered with metformin. The glyburide component of GLUCOVANCE, therefore, is not bioequivalent to Micronase®. The metformin component of GLUCOVANCE is bioequivalent to metformin coadministered with glyburide.
Following administration of a single GLUCOVANCE 5 mg/500 mg tablet with either a 20% glucose solution or a 20% glucose solution with food, there was no effect of food on the Cmax and a relatively small effect of food on the AUC of the glyburide component. The Tmax for the glyburide component was shortened from 7.5 hours to 2.75 hours with food compared to the same tablet strength administered fasting with a 20% glucose solution. The clinical significance of an earlier Tmax for glyburide after food is not known. The effect of food on the pharmacokinetics of the metformin component was indeterminate.
Glyburide
Single-dose studies with Micronase® tablets in normal subjects demonstrate significant absorption of glyburide within 1 hour, peak drug levels at about 4 hours, and low but detectable levels at 24 hours. Mean serum levels of glyburide, as reflected by areas under the serum concentration-time curve, increase in proportion to corresponding increases in dose. Bioequivalence has not been established between GLUCOVANCE and single-ingredient glyburide products.
Metformin Hydrochloride
The absolute bioavailability of a 500 mg metformin hydrochloride tablet given under fasting conditions is approximately 50% to 60%. Studies using single oral doses of metformin tablets of 500 mg and 1500 mg, and 850 mg to 2550 mg, indicate that there is a lack of dose proportionality with increasing doses, which is due to decreased absorption rather than an alteration in elimination. Food decreases the extent of and slightly delays the absorption of metformin, as shown by approximately a 40% lower peak concentration and a 25% lower AUC in plasma and a 35-minute prolongation of time to peak plasma concentration following administration of a single 850 mg tablet of metformin with food, compared to the same tablet strength administered fasting. The clinical relevance of these decreases is unknown.
Distribution
Glyburide
Sulfonylurea drugs are extensively bound to serum proteins. Displacement from protein binding sites by other drugs may lead to enhanced hypoglycemic action. In vitro, the protein binding exhibited by glyburide is predominantly non-ionic, whereas that of other sulfonylureas (chlorpropamide, tolbutamide, tolazamide) is predominantly ionic. Acidic drugs, such as phenylbutazone, warfarin, and salicylates, displace the ionic-binding sulfonylureas from serum proteins to a far greater extent than the non-ionic binding glyburide. It has not been shown that this difference in protein binding results in fewer drug-drug interactions with glyburide tablets in clinical use.
Metformin Hydrochloride
The apparent volume of distribution (V/F) of metformin following single oral doses of 850 mg averaged 654±358 L. Metformin is negligibly bound to plasma proteins. Metformin partitions into erythrocytes, most likely as a function of time. At usual clinical doses and dosing schedules of metformin, steady state plasma concentrations of metformin are reached within 24 to 48 hours and are generally <1 µg/mL. During controlled clinical trials, maximum metformin plasma levels did not exceed 5 µg/mL, even at maximum doses.
Metabolism and Elimination
Glyburide
The decrease of glyburide in the serum of normal healthy individuals is biphasic; the terminal half-life is about 10 hours. The major metabolite of glyburide is the 4-trans-hydroxy derivative. A second metabolite, the 3-cis-hydroxy derivative, also occurs. These metabolites probably contribute no significant hypoglycemic action in humans since they are only weakly active (1/400 and 1/40 as active, respectively, as glyburide) in rabbits. Glyburide is excreted as metabolites in the bile and urine, approximately 50% by each route. This dual excretory pathway is qualitatively different from that of other sulfonylureas, which are excreted primarily in the urine.
Metformin Hydrochloride
Intravenous single-dose studies in normal subjects demonstrate that metformin is excreted unchanged in the urine and does not undergo hepatic metabolism (no metabolites have been identified in humans) nor biliary excretion. Renal clearance (see Table 1 ) is approximately 3.5 times greater than creatinine clearance, which indicates that tubular secretion is the major route of metformin elimination. Following oral administration, approximately 90% of the absorbed drug is eliminated via the renal route within the first 24 hours, with a plasma elimination half-life of approximately 6.2 hours. In blood, the elimination half-life is approximately 17.6 hours, suggesting that the erythrocyte mass may be a compartment of distribution.
Special Populations
Patients With Type 2 Diabetes
Multiple-dose studies with glyburide in patients with type 2 diabetes demonstrate drug level concentration-time curves similar to single-dose studies, indicating no buildup of drug in tissue depots.
In the presence of normal renal function, there are no differences between single- or multiple-dose pharmacokinetics of metformin between patients with type 2 diabetes and normal subjects (see Table 1 ), nor is there any accumulation of metformin in either group at usual clinical doses.
Hepatic Insufficiency
No pharmacokinetic studies have been conducted in patients with hepatic insufficiency for either glyburide or metformin.
Renal Insufficiency
No information is available on the pharmacokinetics of glyburide in patients with renal insufficiency.
In patients with decreased renal function (based on creatinine clearance), the plasma and blood half-life of metformin is prolonged and the renal clearance is decreased in proportion to the decrease in creatinine clearance (see Table 1 ; also, see WARNINGS ).
Geriatrics
There is no information on the pharmacokinetics of glyburide in elderly patients.
Limited data from controlled pharmacokinetic studies of metformin in healthy elderly subjects suggest that total plasma clearance is decreased, the half-life is prolonged, and Cmax is increased, when compared to healthy young subjects. From these data, it appears that the change in metformin pharmacokinetics with aging is primarily accounted for by a change in renal function (see Table 1 ). Metformin treatment should not be initiated in patients ≥80 years of age unless measurement of creatinine clearance demonstrates that renal function is not reduced.
|
Subject Groups: Metformin
Dosea
(number of subjects) |
Cmax
b
(µg/mL) |
Tmax
c
(hrs) |
Renal Clearance (mL/min) |
|---|---|---|---|
| a All doses given fasting except the first 18 doses of the multiple-dose studies | |||
| b Peak plasma concentration | |||
| c Time to peak plasma concentration | |||
| d SD=single dose | |||
| e Combined results (average means) of 5 studies: mean age 32 years (range 23-59 years) | |||
| f Kinetic study done following dose 19, given fasting | |||
| g Elderly subjects, mean age 71 years (range 65-81 years) | |||
| h CLcr=creatinine clearance normalized to body surface area of 1.73 m2 | |||
| Healthy, nondiabetic adults: | |||
| 500 mg SDd (24) | 1.03 (±0.33) | 2.75 (±0.81) | 600 (±132) |
| 850 mg SD (74)e | 1.60 (±0.38) | 2.64 (±0.82) | 552 (±139) |
| 850 mg t.i.d. for 19 dosesf (9) | 2.01 (±0.42) | 1.79 (±0.94) | 642 (±173) |
| Adults with type 2 diabetes: | |||
| 850 mg SD (23) | 1.48 (±0.5) | 3.32 (±1.08) | 491 (±138) |
| 850 mg t.i.d. for 19 dosesf (9) | 1.90 (±0.62) | 2.01 (±1.22) | 550 (±160) |
| Elderlyg, healthy nondiabetic adults: | |||
| 850 mg SD (12) | 2.45 (±0.70) | 2.71 (±1.05) | 412 (±98) |
| Renal-impaired adults: 850 mg SD | |||
| Mild (CLcr h 61-90 mL/min) (5) | 1.86 (±0.52) | 3.20 (±0.45) | 384 (±122) |
| Moderate (CLcr 31-60 mL/min) (4) | 4.12 (±1.83) | 3.75 (±0.50) | 108 (±57) |
| Severe (CLcr 10-30 mL/min) (6) | 3.93 (±0.92) | 4.01 (±1.10) | 130 (±90) |
Pediatrics
After administration of a single oral GLUCOPHAGE® (metformin hydrochloride) 500 mg tablet with food, geometric mean metformin Cmax and AUC differed <5% between pediatric type 2 diabetic patients (12-16 years of age) and gender- and weight-matched healthy adults (20-45 years of age), all with normal renal function.
After administration of a single oral GLUCOVANCE tablet with food, dose-normalized geometric mean glyburide Cmax and AUC in pediatric patients with type 2 diabetes (11-16 years of age, n=28, mean body weight of 97 kg) differed <6% from historical values in healthy adults.
Gender
There is no information on the effect of gender on the pharmacokinetics of glyburide.
Metformin pharmacokinetic parameters did not differ significantly in subjects with or without type 2 diabetes when analyzed according to gender (males=19, females=16). Similarly, in controlled clinical studies in patients with type 2 diabetes, the antihyperglycemic effect of metformin was comparable in males and females.
Race
No information is available on race differences in the pharmacokinetics of glyburide.
No studies of metformin pharmacokinetic parameters according to race have been performed. In controlled clinical studies of metformin in patients with type 2 diabetes, the antihyperglycemic effect was comparable in whites (n=249), blacks (n=51), and Hispanics (n=24).
Clinical Studies
Patients with Inadequate Glycemic Control on Diet and Exercise Alone
In a 20-week, double-blind, multicenter U.S. clinical trial, a total of 806 drug-naive patients with type 2 diabetes, whose hyperglycemia was not adequately controlled with diet and exercise alone (baseline fasting plasma glucose [FPG] <240 mg/dL, baseline hemoglobin A1c [HbA1c] between 7% and 11%), were randomized to receive initial therapy with placebo, 2.5 mg glyburide, 500 mg metformin, GLUCOVANCE 1.25 mg/250 mg, or GLUCOVANCE 2.5 mg/500 mg. After 4 weeks, the dose was progressively increased (up to the 8-week visit) to a maximum of 4 tablets daily as needed to reach a target FPG of 126 mg/dL. Trial data at 20 weeks are summarized in Table 2.
| Placebo |
Glyburide 2.5 mg tablets |
Metformin 500 mg tablets |
GLUCOVANCE 1.25 mg/250 mg tablets |
GLUCOVANCE 2.5 mg/500 mg tablets |
|
|---|---|---|---|---|---|
| a p<0.001 | |||||
| b p<0.05 | |||||
| c p=NS | |||||
| Mean Final Dose | 0 mg | 5.3 mg | 1317 mg | 2.78 mg/557 mg | 4.1 mg/824 mg |
| Hemoglobin A1c | N=147 | N=142 | N=141 | N=149 | N=152 |
| Baseline Mean (%) | 8.14 | 8.14 | 8.23 | 8.22 | 8.20 |
| Mean Change from Baseline | −0.21 | −1.24 | −1.03 | −1.48 | −1.53 |
| Difference from Placebo | −1.02 | −0.82 | −1.26a | −1.31a | |
| Difference from Glyburide | −0.24b | −0.29b | |||
| Difference from Metformin | −0.44b | −0.49b | |||
| Fasting Plasma Glucose | N=159 | N=158 | N=156 | N=153 | N=154 |
| Baseline Mean FPG (mg/dL) | 177.2 | 178.9 | 175.1 | 178 | 176.6 |
| Mean Change from Baseline | 4.6 | −35.7 | −21.2 | −41.5 | −40.1 |
| Difference from Placebo | −40.3 | −25.8 | −46.1a | −44.7a | |
| Difference from Glyburide | −5.8c | −4.5c | |||
| Difference from Metformin | −20.3c | −18.9c | |||
|
Body
Weight Mean Change from Baseline |
−0.7 kg | +1.7 kg | −0.6 kg | +1.4 kg | +1.9 kg |
| Final HbA1c Distribution (%) | N=147 | N=142 | N=141 | N=149 | N=152 |
| <7% | 19.7% | 59.9% | 50.4% | 66.4% | 71.7% |
| ≥7% and <8% | 37.4% | 26.1% | 29.8% | 25.5% | 19.1% |
| ≥8% | 42.9% | 14.1% | 19.9% | 8.1% | 9.2% |
Treatment with GLUCOVANCE resulted in significantly greater reduction in HbA1c and postprandial plasma glucose (PPG) compared to glyburide, metformin, or placebo. Also, GLUCOVANCE therapy resulted in greater reduction in FPG compared to glyburide, metformin, or placebo, but the differences from glyburide and metformin did not reach statistical significance.
Changes in the lipid profile associated with GLUCOVANCE treatment were similar to those seen with glyburide, metformin, and placebo.
The double-blind, placebo-controlled trial described above restricted enrollment to patients with HbA1c <11% or FPG <240 mg/dL. Screened patients ineligible for the first trial because of HbA1c and/or FPG exceeding these limits were treated directly with GLUCOVANCE 2.5 mg/500 mg in an open-label, uncontrolled protocol. In this study, 3 out of 173 patients (1.7%) discontinued because of inadequate therapeutic response. Across the group of 144 patients who completed 26 weeks of treatment, mean HbA1c was reduced from a baseline of 10.6% to 7.1%. The mean baseline FPG was 283 mg/dL and reduced to 164 and 161 mg/dL after 2 and 26 weeks, respectively. The mean final titrated dose of GLUCOVANCE was 7.85 mg/1569 mg (equivalent to approximately 3 GLUCOVANCE 2.5 mg/500 mg tablets per day).
Patients with Inadequate Glycemic Control on Sulfonylurea Alone
In a 16-week, double-blind, active-controlled U.S. clinical trial, a total of 639 patients with type 2 diabetes not adequately controlled (mean baseline HbA1c 9.5%, mean baseline FPG 213 mg/dL) while being treated with at least one-half the maximum dose of a sulfonylurea (eg, glyburide 10 mg, glipizide 20 mg) were randomized to receive glyburide (fixed dose, 20 mg), metformin (500 mg), GLUCOVANCE 2.5 mg/500 mg, or GLUCOVANCE 5 mg/500 mg. The doses of metformin and GLUCOVANCE were titrated to a maximum of 4 tablets daily as needed to achieve FPG <140 mg/dL. Trial data at 16 weeks are summarized in Table 3.
|
Glyburide 5 mg tablets |
Metformin 500 mg tablets |
GLUCOVANCE 2.5 mg/500 mg tablets |
GLUCOVANCE 5 mg/500 mg tablets |
|
|---|---|---|---|---|
| a p<0.001 | ||||
| Mean Final Dose | 20 mg | 1840 mg | 8.8 mg/1760 mg | 17 mg/1740 mg |
| Hemoglobin A1c | N=158 | N=142 | N=154 | N=159 |
| Baseline Mean (%) | 9.63 | 9.51 | 9.43 | 9.44 |
| Final Mean | 9.61 | 9.82 | 7.92 | 7.91 |
| Difference from Glyburide | −1.69a | −1.70a | ||
| Difference from Metformin | −1.90a | −1.91a | ||
| Fasting Plasma Glucose | N=163 | N=152 | N=160 | N=160 |
| Baseline Mean (mg/dL) | 218.4 | 213.4 | 212.2 | 210.2 |
| Final Mean | 221.0 | 233.8 | 169.6 | 161.1 |
| Difference from Glyburide | −51.3a | −59.9a | ||
| Difference from Metformin | −64.2a | −72.7a | ||
|
Body
Weight Mean Change from Baseline |
+0.43 kg | −2.76 kg | +0.75 kg | +0.47 kg |
| Final HbA1c Distribution (%) | N=158 | N=142 | N=154 | N=159 |
| <7% | 2.5% | 2.8% | 24.7% | 22.6% |
| ≥7% and <8% | 9.5% | 11.3% | 33.1% | 37.1% |
| ≥8% | 88% | 85.9% | 42.2% | 40.3% |
After 16 weeks, there was no significant change in the mean HbA1c in patients randomized to glyburide or metformin therapy. Treatment with GLUCOVANCE at doses up to 20 mg/2000 mg per day resulted in significant lowering of HbA1c, FPG, and PPG from baseline compared to glyburide or metformin alone.
Addition of Thiazolidinediones to GLUCOVANCE Therapy
In a 24-week, double-blind, multicenter U.S. clinical trial, patients with type 2 diabetes not adequately controlled on current oral antihyperglycemic therapy (either monotherapy or combination therapy) were first switched to open label GLUCOVANCE 2.5 mg/500 mg tablets and titrated to a maximum daily dose of 10 mg/2000 mg. A total of 365 patients inadequately controlled (HbA1c >7.0% and ≤10%) after 10 to 12 weeks of a daily GLUCOVANCE dose of at least 7.5 mg/1500 mg were randomized to receive add-on therapy with rosiglitazone 4 mg or placebo once daily. After 8 weeks, the rosiglitazone dose was increased to a maximum of 8 mg daily as needed to reach a target mean daily glucose of 126 mg/dL or HbA1c <7%. Trial data at 24 weeks or the last prior visit are summarized in Table 4.
|
Placebo + GLUCOVANCE |
Rosiglitazone + GLUCOVANCE |
|
|---|---|---|
| a Adjusted for the baseline mean difference | ||
| b p<0.001 | ||
|
Mean
Final Dose GLUCOVANCE Rosiglitazone |
10
mg/1992 mg 0 mg |
9.6
mg/1914 mg 7.4 mg |
| Hemoglobin A1c | N=178 | N=177 |
| Baseline Mean (%) | 8.09 | 8.14 |
| Final Mean | 8.21 | 7.23 |
| Difference from Placeboa | −1.02b | |
| Fasting Plasma Glucose | N=181 | N=176 |
| Baseline Mean (mg/dL) | 173.1 | 178.4 |
| Final Mean | 181.4 | 136.3 |
| Difference from Placeboa | −48.5b | |
|
Body
Weight Mean Change from Baseline |
+0.03 kg | +3.03 kg |
| Final HbA1c Distribution (%) | N=178 | N=177 |
| <7% | 13.5% | 42.4% |
| ≥7% and <8% | 32.0% | 38.4% |
| ≥8% | 54.5% | 19.2% |
For patients who did not achieve adequate glycemic control on GLUCOVANCE, the addition of rosiglitazone, compared to placebo, resulted in significant lowering of HbA1c and FPG.
Clinical Studies
Patients with Inadequate Glycemic Control on Diet and Exercise Alone
In a 20-week, double-blind, multicenter U.S. clinical trial, a total of 806 drug-naive patients with type 2 diabetes, whose hyperglycemia was not adequately controlled with diet and exercise alone (baseline fasting plasma glucose [FPG] <240 mg/dL, baseline hemoglobin A1c [HbA1c] between 7% and 11%), were randomized to receive initial therapy with placebo, 2.5 mg glyburide, 500 mg metformin, GLUCOVANCE 1.25 mg/250 mg, or GLUCOVANCE 2.5 mg/500 mg. After 4 weeks, the dose was progressively increased (up to the 8-week visit) to a maximum of 4 tablets daily as needed to reach a target FPG of 126 mg/dL. Trial data at 20 weeks are summarized in Table 2.
| Placebo |
Glyburide 2.5 mg tablets |
Metformin 500 mg tablets |
GLUCOVANCE 1.25 mg/250 mg tablets |
GLUCOVANCE 2.5 mg/500 mg tablets |
|
|---|---|---|---|---|---|
| a p<0.001 | |||||
| b p<0.05 | |||||
| c p=NS | |||||
| Mean Final Dose | 0 mg | 5.3 mg | 1317 mg | 2.78 mg/557 mg | 4.1 mg/824 mg |
| Hemoglobin A1c | N=147 | N=142 | N=141 | N=149 | N=152 |
| Baseline Mean (%) | 8.14 | 8.14 | 8.23 | 8.22 | 8.20 |
| Mean Change from Baseline | −0.21 | −1.24 | −1.03 | −1.48 | −1.53 |
| Difference from Placebo | −1.02 | −0.82 | −1.26a | −1.31a | |
| Difference from Glyburide | −0.24b | −0.29b | |||
| Difference from Metformin | −0.44b | −0.49b | |||
| Fasting Plasma Glucose | N=159 | N=158 | N=156 | N=153 | N=154 |
| Baseline Mean FPG (mg/dL) | 177.2 | 178.9 | 175.1 | 178 | 176.6 |
| Mean Change from Baseline | 4.6 | −35.7 | −21.2 | −41.5 | −40.1 |
| Difference from Placebo | −40.3 | −25.8 | −46.1a | −44.7a | |
| Difference from Glyburide | −5.8c | −4.5c | |||
| Difference from Metformin | −20.3c | −18.9c | |||
|
Body
Weight Mean Change from Baseline |
−0.7 kg | +1.7 kg | −0.6 kg | +1.4 kg | +1.9 kg |
| Final HbA1c Distribution (%) | N=147 | N=142 | N=141 | N=149 | N=152 |
| <7% | 19.7% | 59.9% | 50.4% | 66.4% | 71.7% |
| ≥7% and <8% | 37.4% | 26.1% | 29.8% | 25.5% | 19.1% |
| ≥8% | 42.9% | 14.1% | 19.9% | 8.1% | 9.2% |
Treatment with GLUCOVANCE resulted in significantly greater reduction in HbA1c and postprandial plasma glucose (PPG) compared to glyburide, metformin, or placebo. Also, GLUCOVANCE therapy resulted in greater reduction in FPG compared to glyburide, metformin, or placebo, but the differences from glyburide and metformin did not reach statistical significance.
Changes in the lipid profile associated with GLUCOVANCE treatment were similar to those seen with glyburide, metformin, and placebo.
The double-blind, placebo-controlled trial described above restricted enrollment to patients with HbA1c <11% or FPG <240 mg/dL. Screened patients ineligible for the first trial because of HbA1c and/or FPG exceeding these limits were treated directly with GLUCOVANCE 2.5 mg/500 mg in an open-label, uncontrolled protocol. In this study, 3 out of 173 patients (1.7%) discontinued because of inadequate therapeutic response. Across the group of 144 patients who completed 26 weeks of treatment, mean HbA1c was reduced from a baseline of 10.6% to 7.1%. The mean baseline FPG was 283 mg/dL and reduced to 164 and 161 mg/dL after 2 and 26 weeks, respectively. The mean final titrated dose of GLUCOVANCE was 7.85 mg/1569 mg (equivalent to approximately 3 GLUCOVANCE 2.5 mg/500 mg tablets per day).
Patients with Inadequate Glycemic Control on Sulfonylurea Alone
In a 16-week, double-blind, active-controlled U.S. clinical trial, a total of 639 patients with type 2 diabetes not adequately controlled (mean baseline HbA1c 9.5%, mean baseline FPG 213 mg/dL) while being treated with at least one-half the maximum dose of a sulfonylurea (eg, glyburide 10 mg, glipizide 20 mg) were randomized to receive glyburide (fixed dose, 20 mg), metformin (500 mg), GLUCOVANCE 2.5 mg/500 mg, or GLUCOVANCE 5 mg/500 mg. The doses of metformin and GLUCOVANCE were titrated to a maximum of 4 tablets daily as needed to achieve FPG <140 mg/dL. Trial data at 16 weeks are summarized in Table 3.
|
Glyburide 5 mg tablets |
Metformin 500 mg tablets |
GLUCOVANCE 2.5 mg/500 mg tablets |
GLUCOVANCE 5 mg/500 mg tablets |
|
|---|---|---|---|---|
| a p<0.001 | ||||
| Mean Final Dose | 20 mg | 1840 mg | 8.8 mg/1760 mg | 17 mg/1740 mg |
| Hemoglobin A1c | N=158 | N=142 | N=154 | N=159 |
| Baseline Mean (%) | 9.63 | 9.51 | 9.43 | 9.44 |
| Final Mean | 9.61 | 9.82 | 7.92 | 7.91 |
| Difference from Glyburide | −1.69a | −1.70a | ||
| Difference from Metformin | −1.90a | −1.91a | ||
| Fasting Plasma Glucose | N=163 | N=152 | N=160 | N=160 |
| Baseline Mean (mg/dL) | 218.4 | 213.4 | 212.2 | 210.2 |
| Final Mean | 221.0 | 233.8 | 169.6 | 161.1 |
| Difference from Glyburide | −51.3a | −59.9a | ||
| Difference from Metformin | −64.2a | −72.7a | ||
|
Body
Weight Mean Change from Baseline |
+0.43 kg | −2.76 kg | +0.75 kg | +0.47 kg |
| Final HbA1c Distribution (%) | N=158 | N=142 | N=154 | N=159 |
| <7% | 2.5% | 2.8% | 24.7% | 22.6% |
| ≥7% and <8% | 9.5% | 11.3% | 33.1% | 37.1% |
| ≥8% | 88% | 85.9% | 42.2% | 40.3% |
After 16 weeks, there was no significant change in the mean HbA1c in patients randomized to glyburide or metformin therapy. Treatment with GLUCOVANCE at doses up to 20 mg/2000 mg per day resulted in significant lowering of HbA1c, FPG, and PPG from baseline compared to glyburide or metformin alone.
Addition of Thiazolidinediones to GLUCOVANCE Therapy
In a 24-week, double-blind, multicenter U.S. clinical trial, patients with type 2 diabetes not adequately controlled on current oral antihyperglycemic therapy (either monotherapy or combination therapy) were first switched to open label GLUCOVANCE 2.5 mg/500 mg tablets and titrated to a maximum daily dose of 10 mg/2000 mg. A total of 365 patients inadequately controlled (HbA1c >7.0% and ≤10%) after 10 to 12 weeks of a daily GLUCOVANCE dose of at least 7.5 mg/1500 mg were randomized to receive add-on therapy with rosiglitazone 4 mg or placebo once daily. After 8 weeks, the rosiglitazone dose was increased to a maximum of 8 mg daily as needed to reach a target mean daily glucose of 126 mg/dL or HbA1c <7%. Trial data at 24 weeks or the last prior visit are summarized in Table 4.
|
Placebo + GLUCOVANCE |
Rosiglitazone + GLUCOVANCE |
|
|---|---|---|
| a Adjusted for the baseline mean difference | ||
| b p<0.001 | ||
|
Mean
Final Dose GLUCOVANCE Rosiglitazone |
10
mg/1992 mg 0 mg |
9.6
mg/1914 mg 7.4 mg |
| Hemoglobin A1c | N=178 | N=177 |
| Baseline Mean (%) | 8.09 | 8.14 |
| Final Mean | 8.21 | 7.23 |
| Difference from Placeboa | −1.02b | |
| Fasting Plasma Glucose | N=181 | N=176 |
| Baseline Mean (mg/dL) | 173.1 | 178.4 |
| Final Mean | 181.4 | 136.3 |
| Difference from Placeboa | −48.5b | |
|
Body
Weight Mean Change from Baseline |
+0.03 kg | +3.03 kg |
| Final HbA1c Distribution (%) | N=178 | N=177 |
| <7% | 13.5% | 42.4% |
| ≥7% and <8% | 32.0% | 38.4% |
| ≥8% | 54.5% | 19.2% |
For patients who did not achieve adequate glycemic control on GLUCOVANCE, the addition of rosiglitazone, compared to placebo, resulted in significant lowering of HbA1c and FPG.
How Supplied / Storage and Handling
GLUCOVANCE® (Glyburide and Metformin HCl) Tablets
GLUCOVANCE 2.5 mg/500 mg tablet is a pale orange, capsule-shaped, bevel-edged, biconvex, film-coated tablet with "BMS" debossed on one side and "6073" debossed on the opposite side.
| GLUCOVANCE |
|
|
| Glyburide (mg) | Metformin hydrochloride (mg) | Bottle of 100 |
| 2.5 | 500 | NDC 54868-4609-1 |
STORAGE
Store at temperatures up to 25°C (77°F). [See USP Controlled Room Temperature.]
Dispense in light-resistant containers.
Patient Counseling Information
GLUCOVANCE
Patients should be informed of the potential risks and benefits of GLUCOVANCE and alternative modes of therapy. They should also be informed about the importance of adherence to dietary instructions; a regular exercise program; and regular testing of blood glucose, glycosylated hemoglobin, renal function, and hematologic parameters.
The risks of lactic acidosis associated with metformin therapy, its symptoms, and conditions that predispose to its development, as noted in the WARNINGS and PRECAUTIONS sections, should be explained to patients. Patients should be advised to discontinue GLUCOVANCE immediately and promptly notify their health practitioner if unexplained hyperventilation, myalgia, malaise, unusual somnolence, or other nonspecific symptoms occur. Once a patient is stabilized on any dose level of GLUCOVANCE, gastrointestinal symptoms, which are common during initiation of metformin therapy, are unlikely to be drug related. Later occurrence of gastrointestinal symptoms could be due to lactic acidosis or other serious disease.
The risks of hypoglycemia, its symptoms and treatment, and conditions that predispose to its development should be explained to patients and responsible family members.
Patients should be counseled against excessive alcohol intake, either acute or chronic, while receiving GLUCOVANCE. (See Patient Information printed below.)